Overhauled Diagrams
In the competitive Amazon automotive aftermarket, the images placed in secondary slots (PT01, PT02, PT03, etc.) play a crucial role in converting interest into sales. While the MAIN image may get the initial click, these secondary images are where customers evaluate fitment, understand technical details, and make the final decision to purchase.
At Rev Supply Co., the diagrams we placed in these secondary slots, as well as in our printed instruction booklets, were functional but dated. They were flat, schematic vector drawings with minimal real-world context. While they conveyed the required information, they lacked visual authority and left too much room for interpretation. This caused hesitation at the buying stage and contributed to higher-than-necessary return rates.
The same shortcomings carried over into our printed instruction booklets, which were supposed to help customers install products correctly. Instead, the visuals often left steps open to interpretation, leading to installation errors, warranty claims, and unnecessary support calls. The challenge was not only aesthetic. The diagrams were underperforming as tools for both pre-purchase education and post-purchase guidance.
The Challenge
Amazon listing performance data showed that our click-through rates and conversion rates were below potential. Fitment-related returns were costing us money and reducing customer trust. Customers browsing our listings did not have enough visual clarity to feel certain about compatibility, and even those who purchased often struggled to install the product correctly.
The same diagrams were used in printed instructions with little adaptation. This meant the issues present online were carried directly into the customer’s installation experience. The goal was to create diagrams that could sell more effectively in Amazon’s secondary image slots and guide more successfully in printed materials.
Rethinking Visualization Techniques
When I stepped in as Digital Marketing Director, I knew that this would require more than a surface-level redesign. We needed a new process for creating diagrams that would be technically precise, visually compelling, and repeatable at scale across hundreds of SKUs.
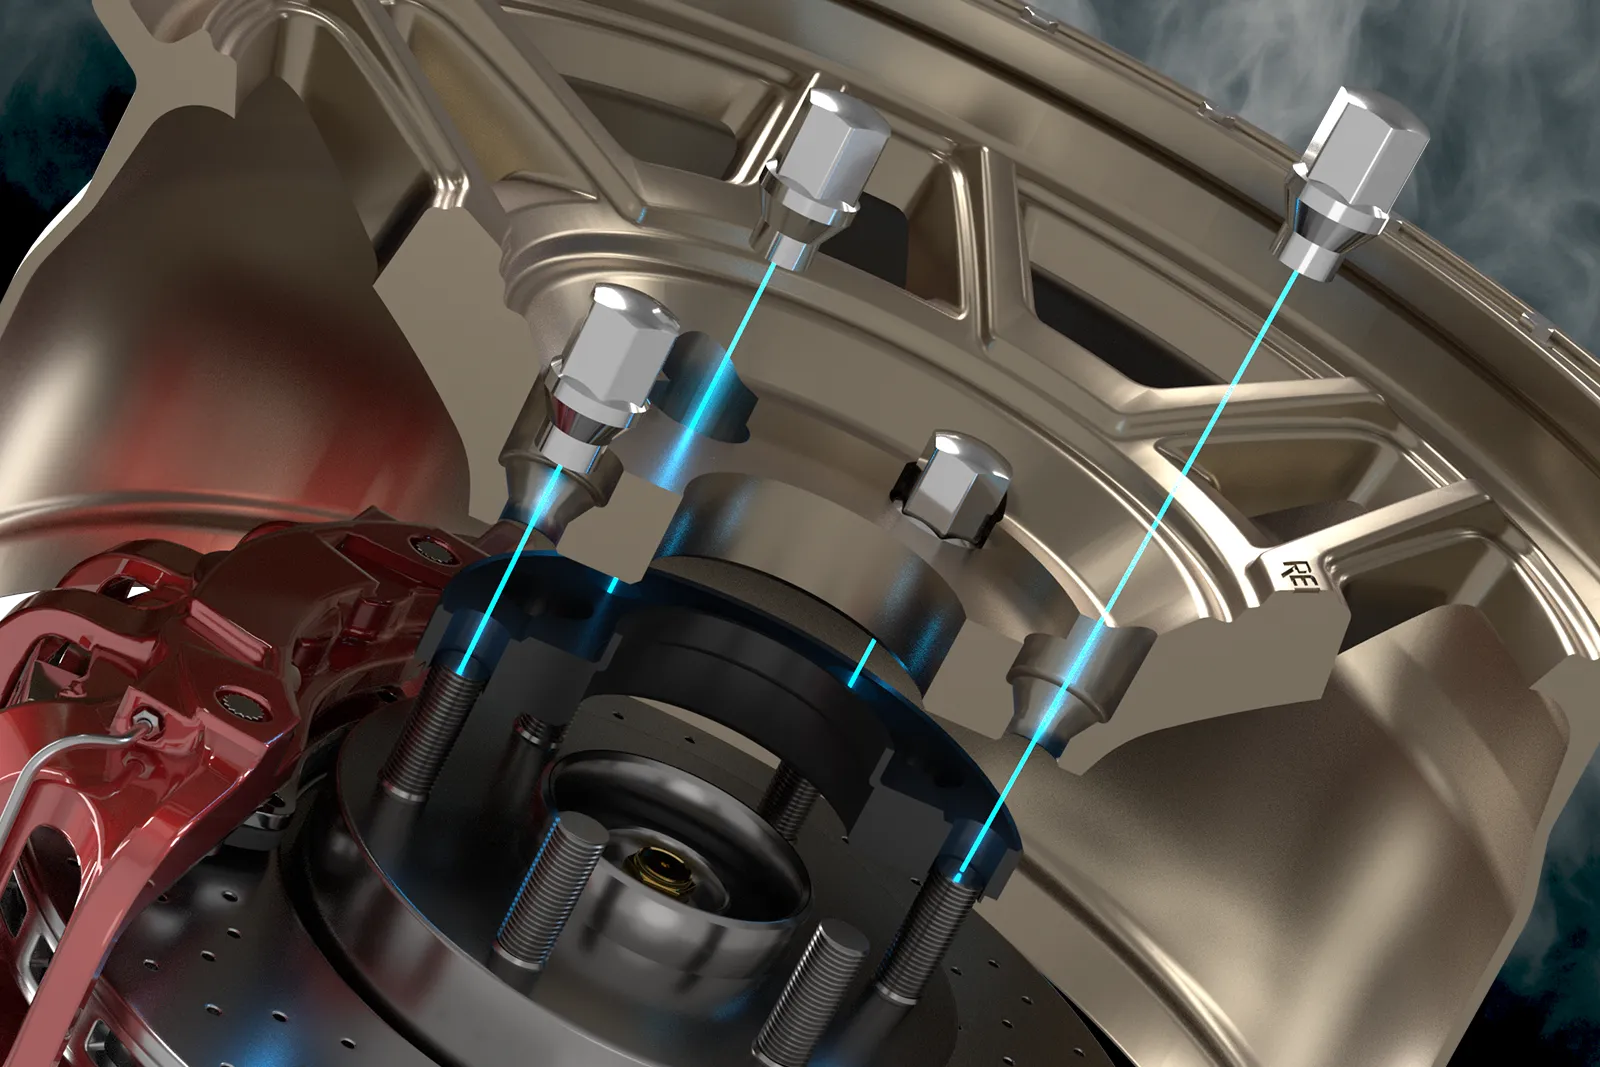
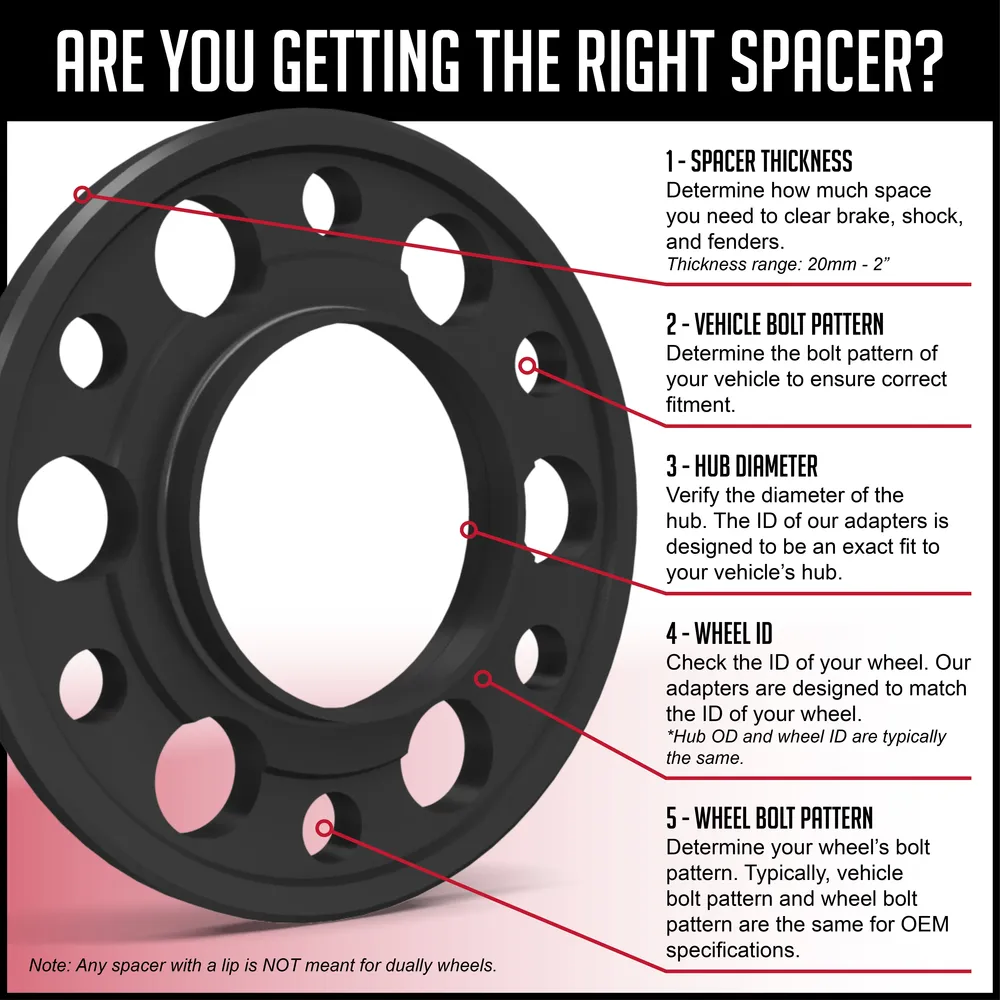
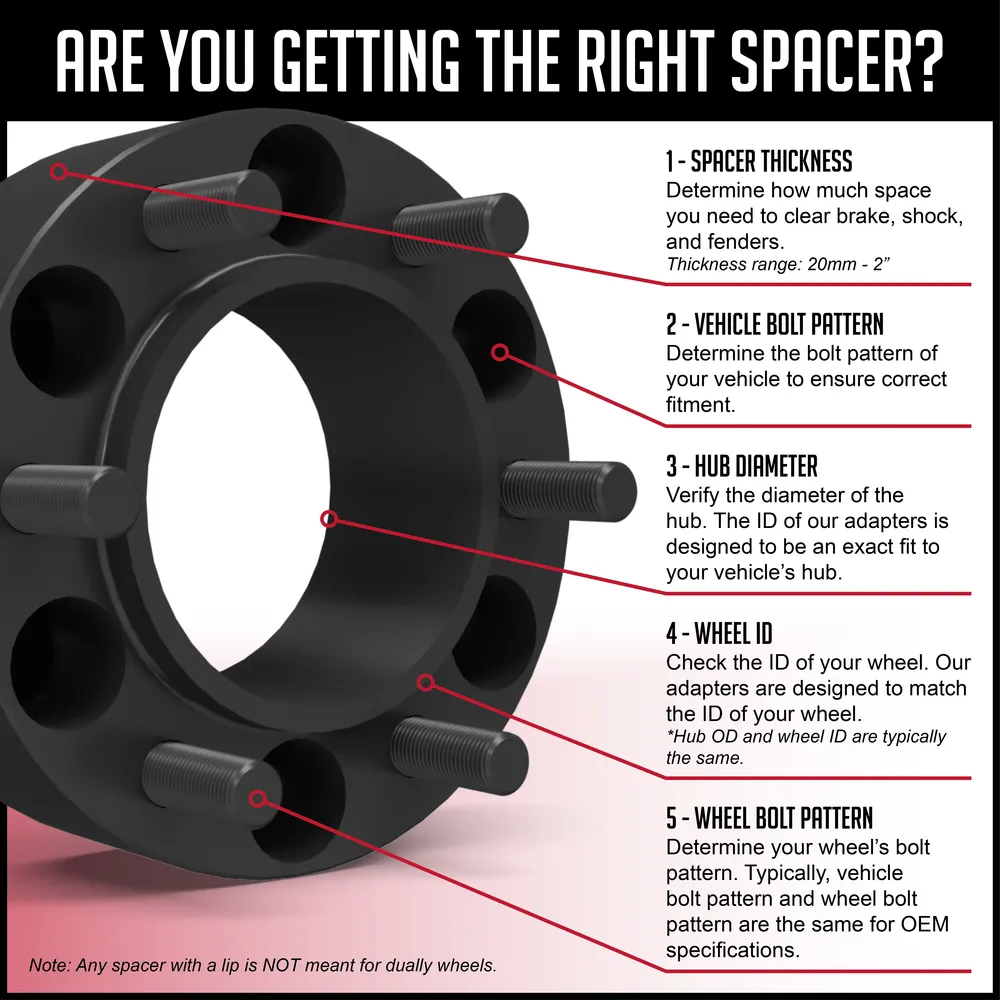
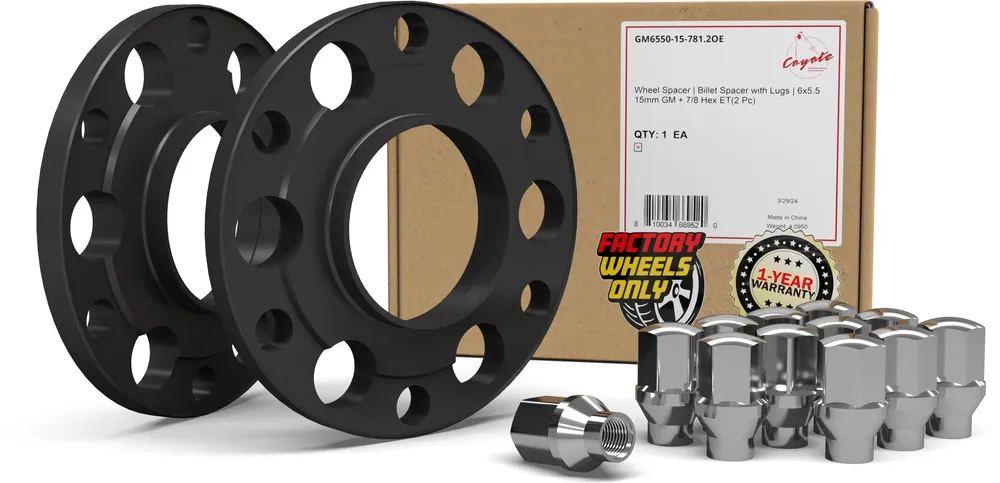
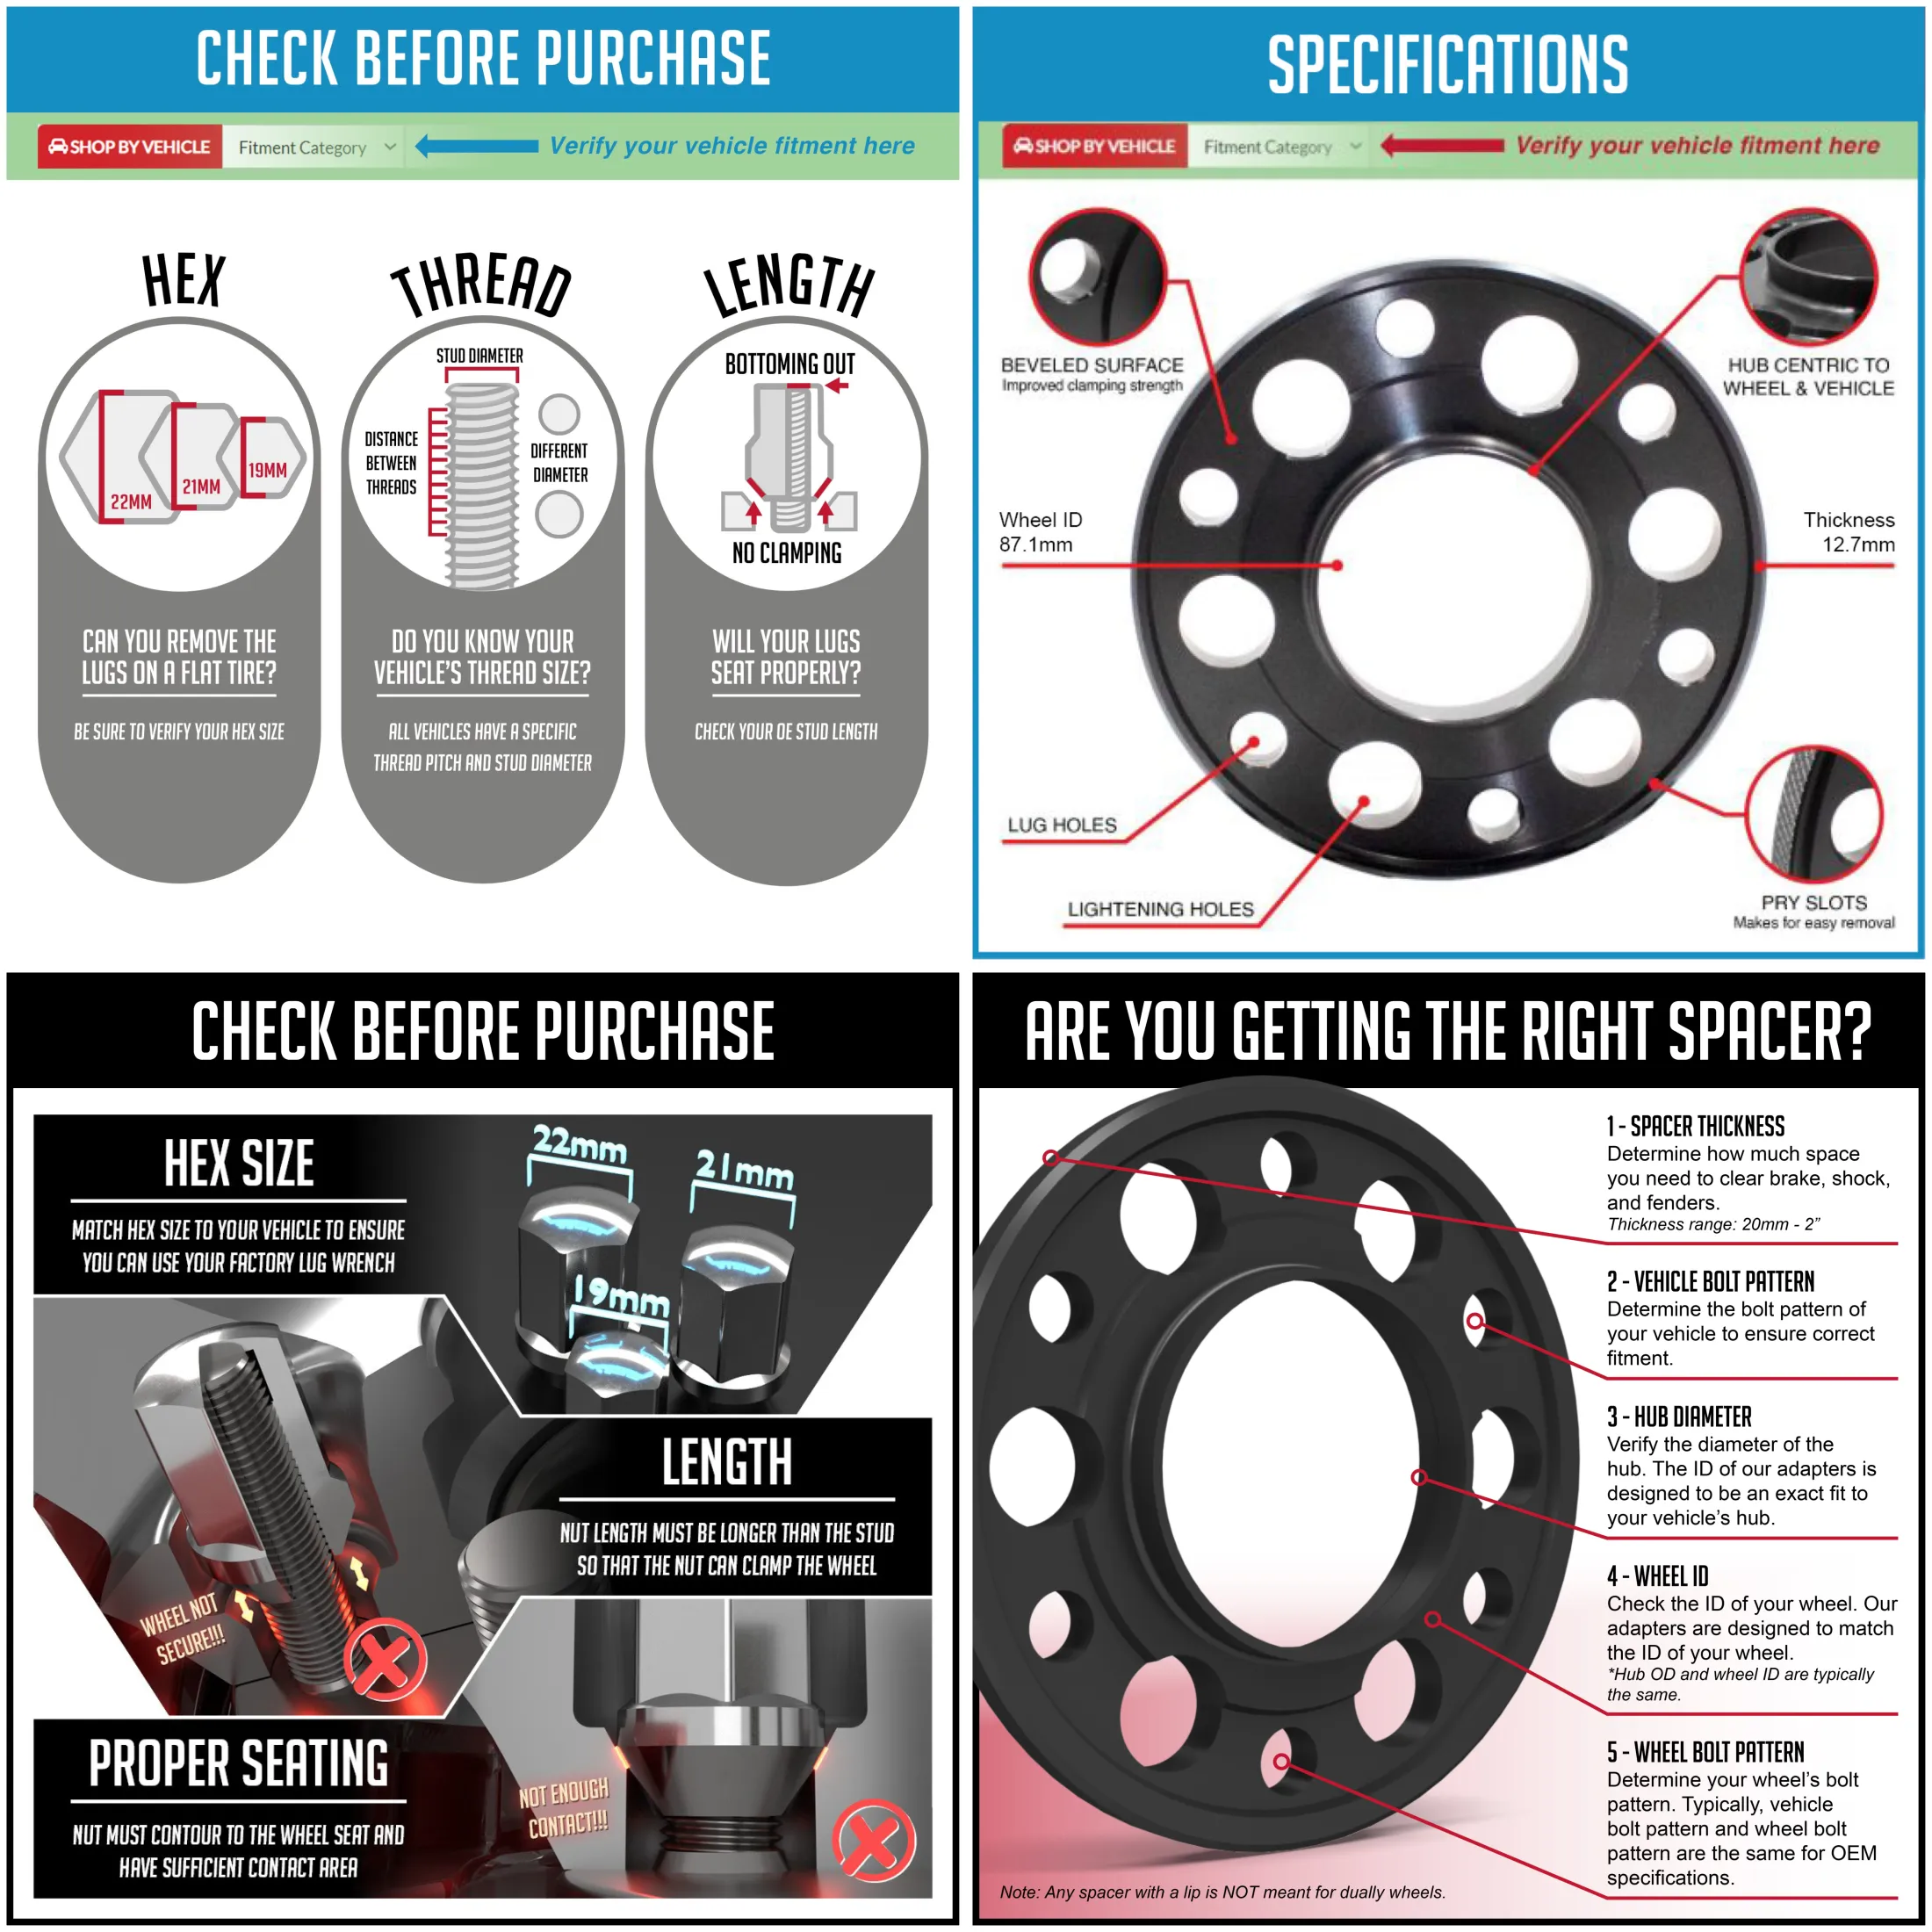
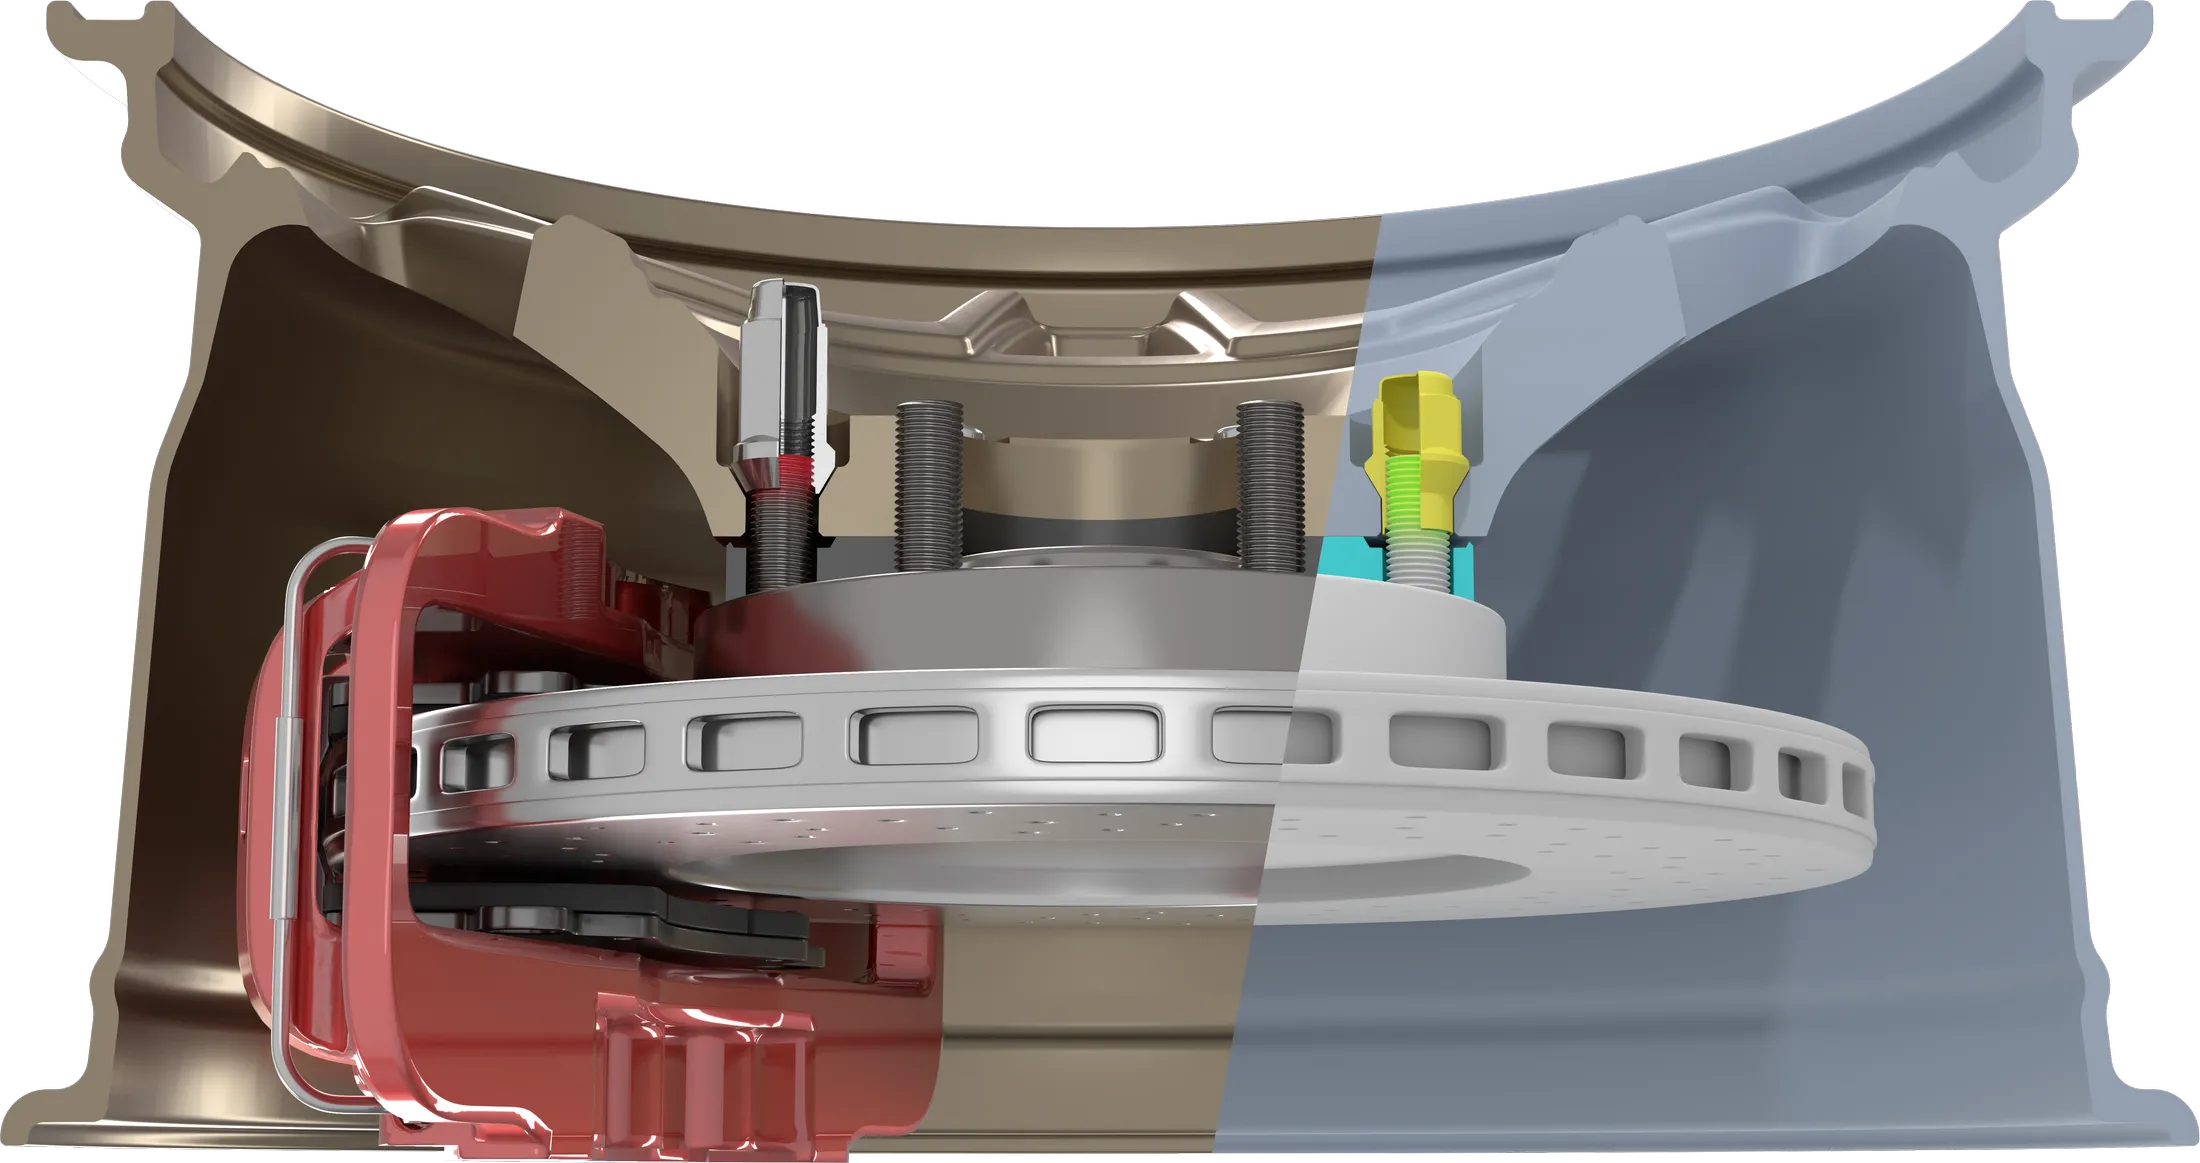
Applying methods I pioneered in past projects like //Whitaker and //Eustis, I built a fully parameterized 3D visualization environment in Blender. This setup included meticulously scaled models of all relevant components, including wheel hubs, brake calipers, lug nuts, spacers, wheels, and tires. With this environment, we could simulate full assemblies in accurate proportion. Variables such as bolt pattern could be adjusted instantly, allowing us to adapt diagrams for different vehicle specifications without rebuilding scenes from scratch.
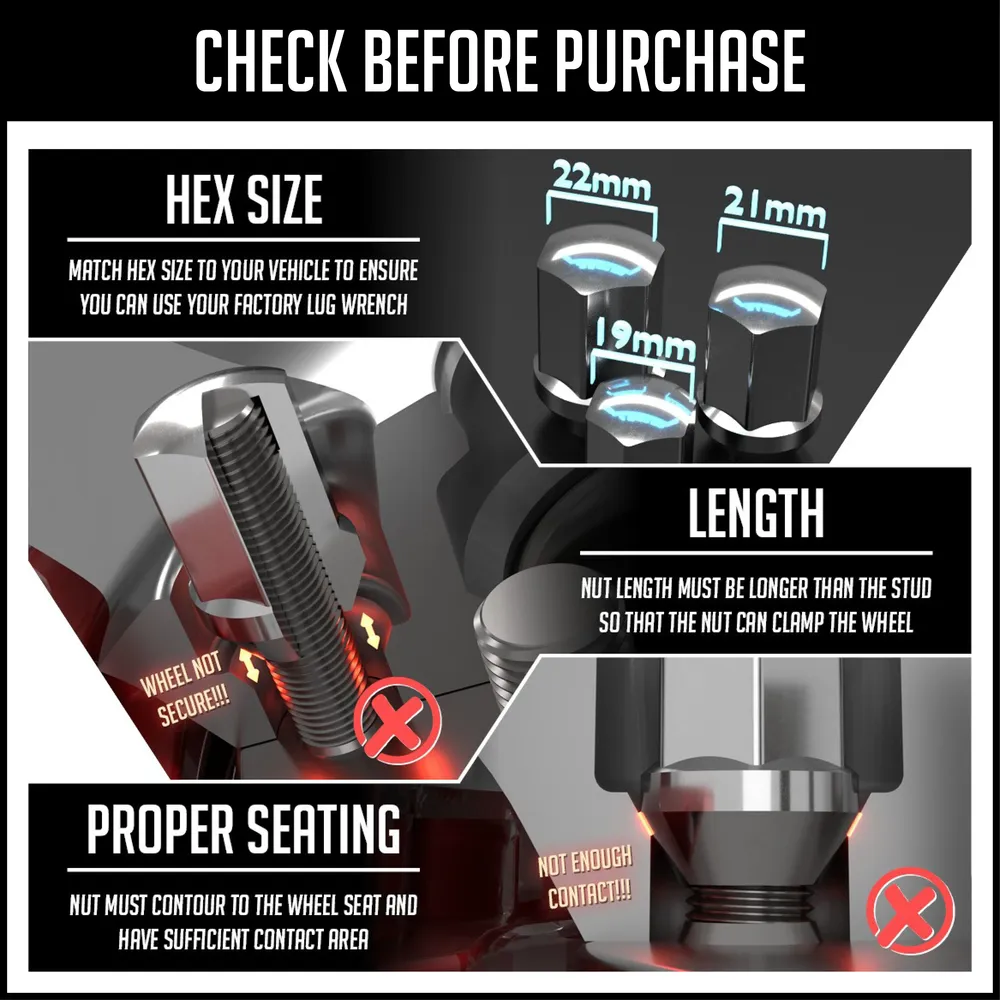
The system allowed us to produce both correct and incorrect fitment scenarios quickly, showing exactly why a product would or would not work for a given application. Lighting, materials, and camera angles were optimized for photorealism, creating visuals that closely matched what customers would see in person.
Elevating the Brand Design of the Diagrams
Accuracy was only half of the equation. We also needed a design approach that would make the diagrams stand out in Amazon’s image carousel and look equally polished in printed form.
I reworked the color palette for higher contrast and better visual separation of key elements. Layouts were redesigned for logical flow, guiding the viewer’s eye from the main subject to supporting details without distraction. Typography was chosen for clarity and legibility at both desktop and mobile viewing sizes.
The result was an aesthetic that felt sharper and more performance-oriented. It had a cool factor that resonated with our audience while being more instructional in practice. This allowed us to create diagrams that were not just functional but also aligned with the brand’s identity as a precision-driven automotive supplier.
From Conception to Delegation
Once the new methodology was proven, I documented every step into a set of Standard Operating Procedures (SOPs) that covered the Blender scene structure, parameter adjustments, rendering settings, export formats, and branded design templates.
I then hired a graphic designer with Blender experience, trained him on these SOPs, and coached him through the reasoning behind each step. This allowed him to take over day-to-day diagram production while maintaining the same high standard of technical accuracy and visual consistency that I had established.
By creating a documented and transferable process, I ensured that the system could operate at full capacity without bottlenecks. We were able to produce consistent, on-brand diagrams for every new product added to Amazon or packaged with our printed materials.
Impact on Amazon
Once the new diagrams were rolled out to Amazon, the results were undeniable:
| Metric | Before Improvement | After Improvement | Change (%) |
|---|---|---|---|
| Click-Through Rate (CTR) | 2.6% | 3.7% | +43.3% |
| Detail Page Conversion Rate | 10.2% | 16.5% | +61.4% |
| Return Rate | Confidential | Confidential | -31.2% |
| Average Order Value (AOV) | Confidential | Confidential | +14.9% |
Click-Through Rate (CTR) – Up 43.3%
The rise from 2.6% to 3.7% was a direct reflection of how the redesigned diagrams influenced buyer behavior even before they opened the listing. On Amazon, secondary images often appear as alternate view previews in search results. Our new, high-contrast, brand-aligned diagrams drew attention because they did not resemble the typical cluttered or purely photographic images in competing listings. This visual distinction piqued curiosity and encouraged more shoppers to click through, creating a larger pool of potential buyers landing on the product page.
Detail Page Conversion Rate – Up 61.4%
This was the clearest proof that the diagrams were doing their job. Once shoppers landed on the page, the improved diagrams gave them the information they needed to confidently move forward with a purchase. By showing accurate, to-scale fitment alongside clear visual cues for correct and incorrect applications, we eliminated the uncertainty that often stalls conversions. The diagrams functioned as a quick visual checklist for compatibility, allowing shoppers to make a yes-or-no decision without having to read through dense text descriptions.
Return Rate – Down 31.2%
The diagrams did more than help customers decide to buy — they helped them decide not to buy when the product was not compatible. By making incompatibility visually obvious in the secondary images, we prevented mismatched purchases at the source. This reduction in “bad buys” directly translated to fewer returns. Beyond the logistical and financial benefits of reduced returns, this also improved seller health metrics on Amazon, which are critical to maintaining visibility and eligibility for programs like Buy Box and Prime.
With this environment, we could simulate full assemblies in accurate proportion. Variables such as bolt pattern could be adjusted instantly, allowing us to adapt diagrams for different vehicle specifications without rebuilding scenes from scratch.
Average Order Value (AOV) – Up 14.9%
When customers felt confident about fitment, they were more willing to buy additional related items. The diagrams indirectly encouraged this behavior by resolving doubts about the primary purchase, which in turn made upsells, bundles, and complementary products feel like safe add-ons. In some cases, the diagrams themselves suggested related components that could enhance performance or complete an installation, creating a subtle but effective cross-selling opportunity.
Impact in Printed Instruction Booklets
The same diagrams that improved Amazon performance also transformed the experience for customers after purchase. By integrating the updated diagrams into printed installation booklets, we ensured consistency between what customers saw online and what they used during installation.
This visual consistency reduced installation mistakes, which lowered warranty claims and product replacements. Support calls related to fitment or installation dropped noticeably. Customer feedback frequently mentioned the clarity and professionalism of the diagrams, reinforcing the brand’s reputation for quality and attention to detail.
Conclusion
By building a Blender-based visualization system and pairing it with a modernized design language, I transformed our Amazon secondary slot diagrams from flat, schematic drawings into powerful sales and support assets. These diagrams improved pre-purchase clarity, boosted clicks and conversions, and delivered post-purchase confidence through better installation guidance.
The documented process I created allowed the workflow to be handed off to a trained designer without loss of quality. This ensured that every future product launch would benefit from the same level of technical accuracy and brand alignment. The result was a sustainable competitive advantage that drove measurable improvements in revenue, reduced returns, and elevated the customer experience from the first click to final installation.